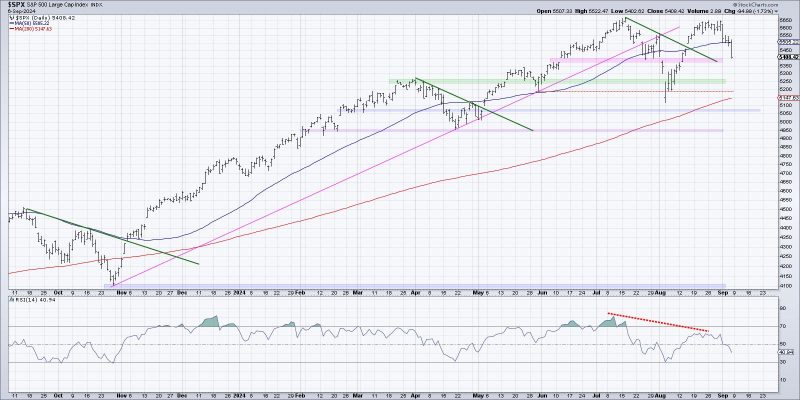
As we delve into the intricacies of market analysis, it becomes evident that historical data can serve as a vital tool in predicting potential market tops. One such method involves the examination of key charts to identify trends and patterns that may indicate an approaching peak. In this article, we will explore three charts that are currently sending signals that the market may be nearing a top.
The first chart we will examine is the Price-to-Earnings (P/E) ratio. The P/E ratio is a metric used to evaluate a company’s current share price relative to its earnings per share. A high P/E ratio may signal that a stock is overvalued, indicating that market participants are willing to pay a premium for a company’s earnings. As we observe the current market landscape, we can see that P/E ratios across various indices and sectors have reached elevated levels. This uptrend in P/E ratios suggests that investors are becoming increasingly optimistic about future earnings potential, potentially setting the stage for a market top.
Moving on to the second chart, we shift our focus to the Volatility Index (VIX). The VIX, often referred to as the fear gauge, measures market volatility and investor sentiment. A low VIX reading may indicate that market participants are complacent and not factoring in potential risks. Conversely, a rising VIX may suggest growing uncertainty and anxiety among investors. Currently, the VIX has been trending downwards, reaching levels not seen since before the Covid-19 pandemic. This decline in volatility could signal a heightened level of complacency in the market, which historically has preceded market corrections.
Lastly, we turn our attention to the trendline chart. Trendlines are used to identify the direction of a security’s price movement over a specific timeframe. By connecting the highs or lows of an asset’s price, trendlines can help investors identify key levels of support and resistance. When analyzing the trendline chart of a market index or individual stocks, it is crucial to pay attention to any deviations from the established trend. In recent months, we have seen many stocks breaking out of long-term trendlines to the upside, suggesting a potential overheating of the market.
In conclusion, by dissecting these three key charts – the P/E ratio, VIX, and trendline chart – investors can gain valuable insights into the current state of the market and potential warning signs of an impending market top. While no one can predict the precise timing of a market peak, staying vigilant and monitoring these indicators can help investors navigate volatile market conditions and make informed decisions to protect their portfolios. As always, diversification, risk management, and a long-term perspective remain essential components of a successful investment strategy in any market environment.


