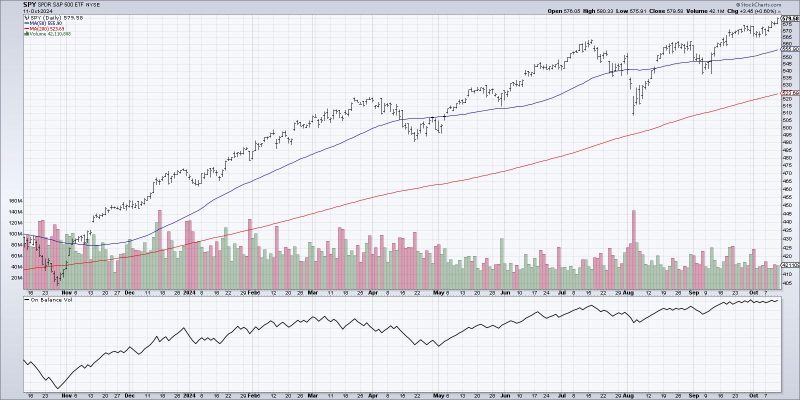
The Relative Volume Indicator: An Essential Tool for Traders
Understanding market volume is crucial for successful trading, and one key indicator that traders should pay attention to is the Relative Volume Indicator (RVI). This indicator provides valuable insights into the strength and momentum of price movements by comparing the current trading volume with the average volume over a specified period.
The RVI is calculated by dividing the current volume by the average volume for the chosen period. A reading above 1 indicates higher-than-average volume, suggesting increased market interest and potentially stronger price movements. Conversely, a reading below 1 indicates lower-than-average volume, which may signal weaker market participation and potential price reversals.
Traders can use the RVI in various ways to enhance their trading strategies. One common approach is to look for confirmation of price trends. For example, if the price is trending upwards and the RVI is also above 1, it can indicate a strong and sustainable uptrend. On the other hand, if the price is rising but the RVI is below 1, it may suggest that the uptrend is losing momentum and could reverse.
Another way to use the RVI is to identify potential reversals. When the price makes a significant move in one direction but the RVI fails to confirm the move with high volume, it could be a warning sign of a trend reversal. Traders can use this divergence between price and volume to anticipate potential market turning points and adjust their positions accordingly.
Moreover, combining the RVI with other technical indicators can provide more comprehensive insights into market dynamics. For example, pairing the RVI with moving averages or trendlines can help confirm signals and filter out false trading opportunities. By integrating multiple indicators, traders can increase the accuracy of their analysis and make more informed trading decisions.
It’s important to note that the RVI is not a standalone indicator and should be used in conjunction with other tools and analysis methods. Like any technical tool, it has its limitations and should be considered within the broader context of market conditions, trends, and risk management strategies.
In conclusion, the Relative Volume Indicator is a valuable tool for traders to gauge market activity, identify trends, and anticipate potential reversals. By understanding and incorporating the RVI into their trading toolbox, traders can enhance their decision-making process and improve their overall trading performance.


