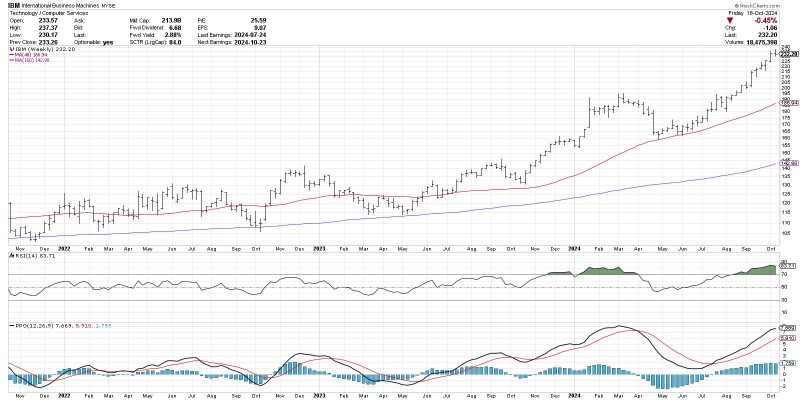
The Moving Average Convergence Divergence (MACD) histogram is a powerful tool in technical analysis that can provide valuable insights into anticipating potential trend changes in the financial markets. This indicator, derived from the MACD line and signal line, can help traders identify shifts in momentum and potential entry or exit points for their positions.
Understanding how the MACD histogram works is essential for successfully incorporating it into your trading strategy. The histogram represents the difference between the MACD line and the signal line, plotted as a histogram bar chart. When the histogram is above the zero line, it indicates that the MACD line is above the signal line, signaling a bullish trend. Conversely, when the histogram is below the zero line, it suggests that the MACD line is below the signal line, indicating a bearish trend.
One of the key features of the MACD histogram is its ability to provide early signals of potential trend changes. Traders often look for divergences between the histogram and price action, where the histogram shows a different pattern from the price movement. Bullish divergence occurs when the price makes lower lows while the histogram makes higher lows, suggesting that the downtrend may be losing momentum and a potential reversal could be imminent. On the other hand, bearish divergence is identified when the price makes higher highs while the histogram makes lower highs, indicating that the uptrend may be weakening.
The MACD histogram can also be used in conjunction with other technical indicators to confirm trend changes and filter out false signals. For example, traders may combine the MACD histogram with trend lines, support and resistance levels, or other momentum oscillators to increase the accuracy of their trading decisions.
Furthermore, traders can utilize the MACD histogram to identify potential entry and exit points for their trades. When the histogram crosses above the zero line, it can be interpreted as a buy signal, suggesting that bullish momentum is strengthening. Conversely, when the histogram crosses below the zero line, it can be seen as a sell signal, indicating that bearish momentum is picking up.
In conclusion, the MACD histogram is a valuable tool for traders looking to anticipate trend changes and make informed trading decisions. By understanding how to interpret the histogram and integrate it with other technical indicators, traders can gain a clearer insight into market dynamics and improve their trading performance. Whether used alone or in combination with other tools, the MACD histogram holds the potential to unlock profitable opportunities in the financial markets.


